Post Event Report: Event Specific
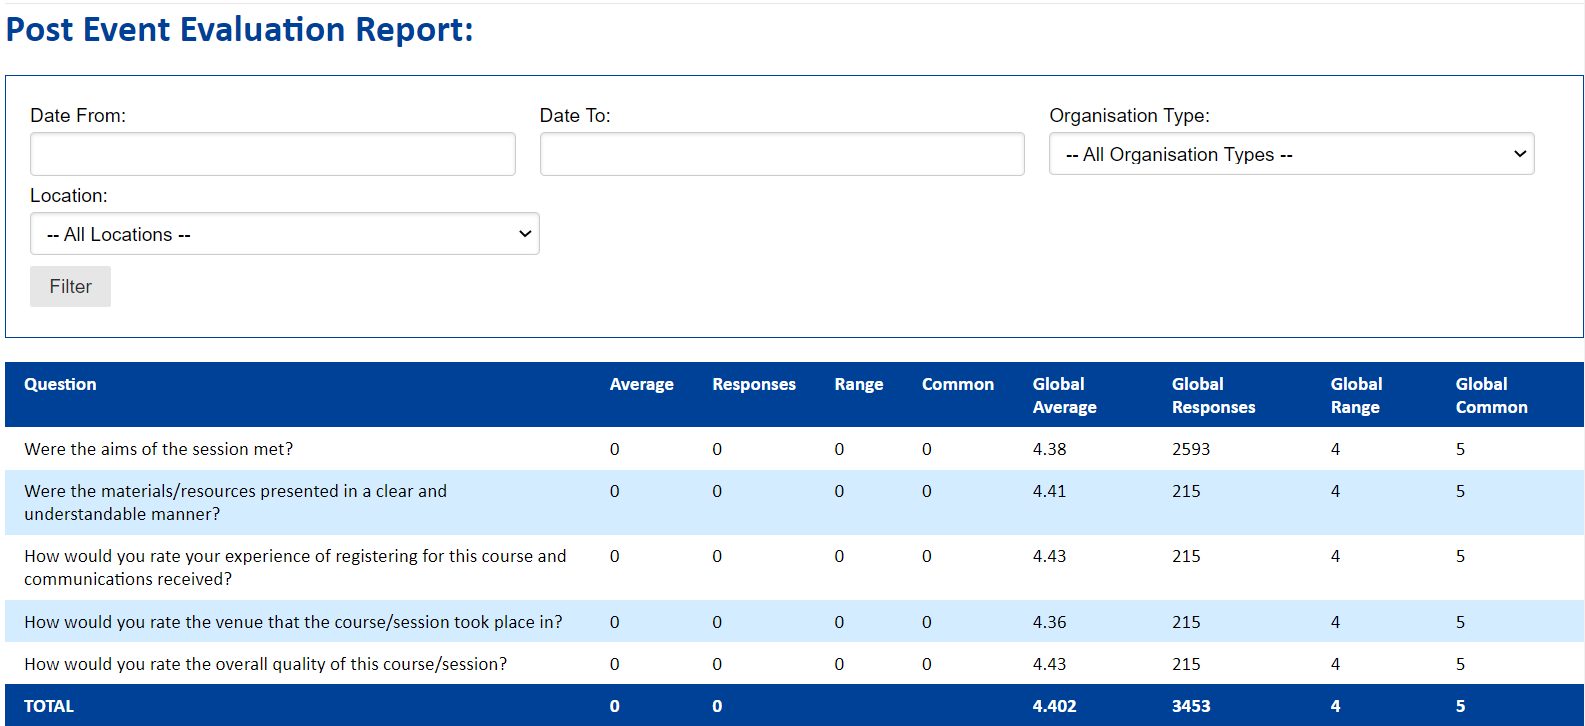
These figures can be filtered by date, Organisation Type and Location. At the top of the page, you will see options to either go back to the previous page, print the page or download it as a CSV (Excel) file.
These are the Post Event questions that you set up to apply to every event. In the table below the filter options you will see a list of all the questions as well as; the average of the numerical results, the number of responses submitted, the rang of the numerical results, the most common numerical result, the global average (across all events), global number of responses submitted, global range and global common. The bottom row of the table will give you the total figures.
Post Event: By Event
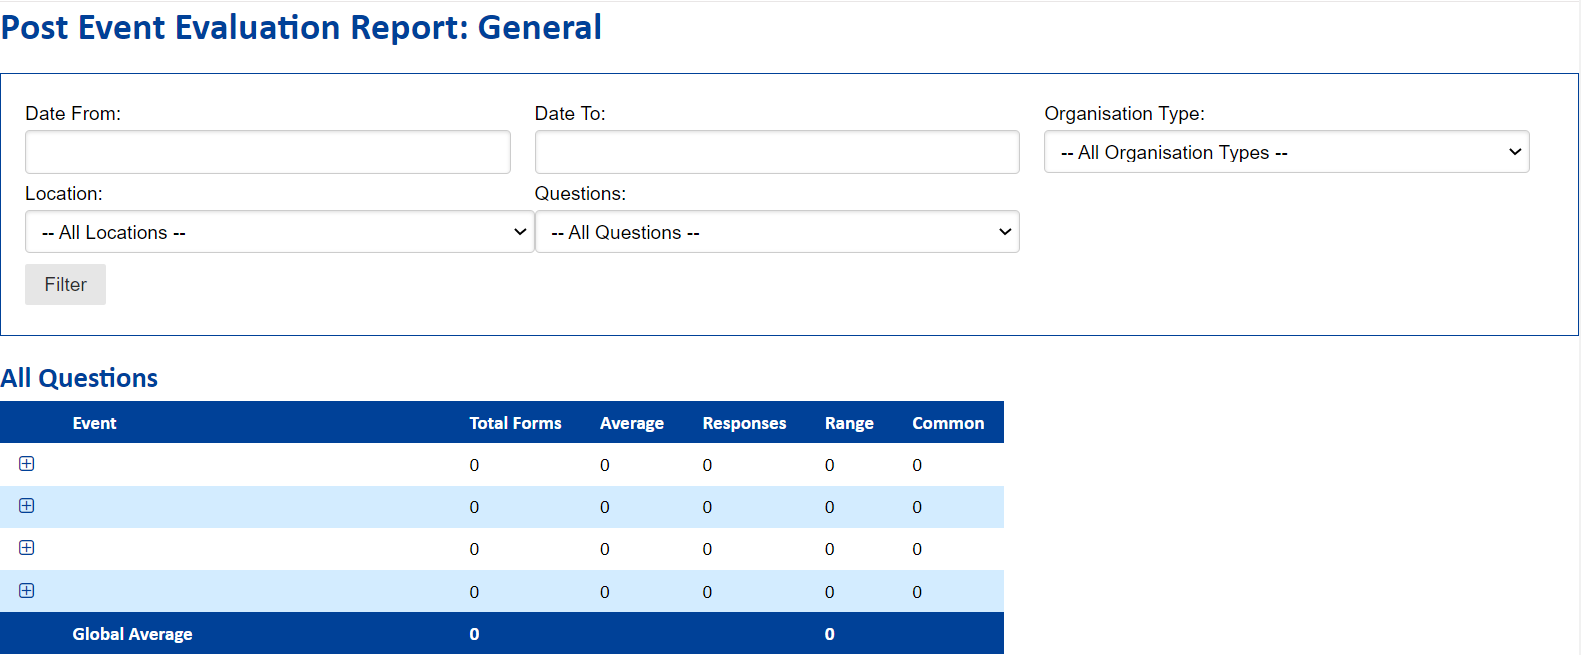
These figures can be filtered by Date, Organisation Type, Location and Question. At the top of the page, you will see options to either go back to the previous page, print the page or download it as a CSV (Excel) file.
In the table above you will see a list of all your events, with your chosen event highlighted in green. The table will show the average response for the Post Event questions (the non-event specific ones), the number of responses received the range and the common for each event. By clicking on the plus icon to the left of an event, a new page will open with the breakdown of answers for each question for that event. This is the same as the table shown in the Post Event report in the Event Specific table.
Still, looking for further information?
Email us at support@phew.org.uk and we will be able to give further clarification on any questions.